
December 08, 2018 / Swizec Teller
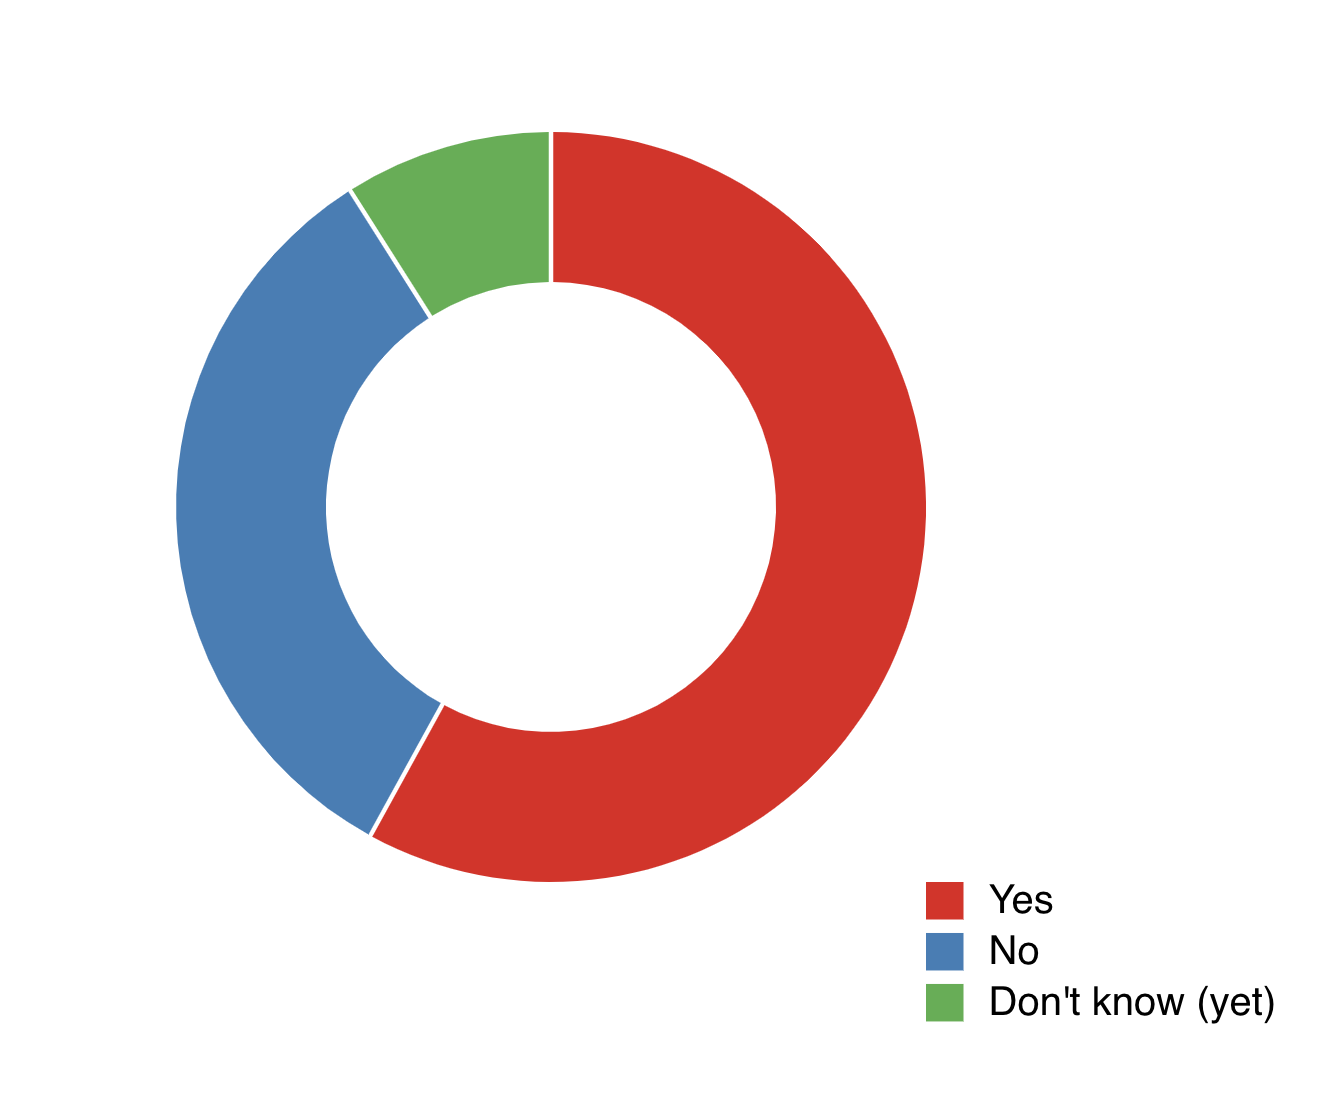
Will you buy a Christmas tree?
Not everyone buys a Christmas tree. 🎄 Draw a donut chart of people's thoughts.
Dataset: Download dataset 🗳
My solution 👇
How it works ⚙️
This donut chart build was short and sweet. D3 has all the ingredients we need, Chroma's got the colors, d3-svg-legend has nice legend stuff. Oh and we used it as an excuse to update my d3blackbox library so it actually exports the hooks version.
Thought it did, had it in the docs, published version didn't have it. 20 day old issue report on GitHub. Oops 😅
You can see data loading in the Codesandbox above. Here's the fun stuff
React and D3 pie chart tutorial with React hooks
Pie charts and donut charts are the same. If there's a hole in the middle it's a donut, otherwise it's a pie. You should always make donuts because donuts are delicious and easier to read due to intricacies around area size perception.
Our code fits in a functional React component
const TreeDonut = ({ data, x, y, r }) => {}
Takes data, x,y coordinates for positioning, and r for the total radius.
We begin with a bunch of D3 objects. Scales, pie generators, things like that.
const pie = d3.pie().value(d => d.percentage)
const arc = d3
  .arc()
  .innerRadius(90)
  .outerRadius(r)
  .padAngle(0.01)
const color = chroma.brewer.set1
const colorScale = d3
  .scaleOrdinal()
  .domain(data.map(d => d.answer))
  .range(color)
Here's what they do:
- The
d3.pie()generator takes data and returns everything you need to create a pie chart. Start and end angles of each slice and a few extras. - The
d3.arc()generator creates path definitions for pie slices. We define inner and outer radiuses and add some padding. - We take the
colorlist from one of Chroma's pre-defined colors. - We'll use
colorScalefor the legend. Maps answers from our dataset to their colors
Next thing we need is some state for the overlay effect. It says which slice is currently selected.
const [selected, setSelected] = useState(null)
Hooks make this way too easy. 😛 We'll use setSelected to set the value and store it in selected.
Then we render it all with a loop.
return (
  <g transform={`translate(${x}, ${y})`}>
    {pie(data).map(d => (
      <path
        d={arc
          .outerRadius(selected === d.index ? r + 10 : r)
          .innerRadius(selected === d.index ? 85 : 90)(d)}
        fill={color[d.index]}
        onMouseOver={() => setSelected(d.index)}
        onMouseOut={() => setSelected(null)}
      />
    ))}
    <Legend x={r} y={r} colorScale={colorScale} />
  </g>
)
A grouping element positions our piechart from the center out.
Inside that group, we iterate over the output of our pie() generator and render a <path> for each entry. Its shape comes from the arc generator.
We update inner and outer radius on the fly depending on whether the current slice is highlighted. This creates the become-bigger-on-mouse-over effect. We drive it with mouse event callbacks and the setSelected method.
setSelected stores the current selected index in selected. This triggers a re-render. The selected slice shows as bigger.
Perfect 👌
PS: The legend component with hooks is a piece of cake
d3-svg-legend does it all for us. We use useD3 from my d3blackbox to make it work.
const Legend = function({ x, y, colorScale }) {
  const ref = useD3(anchor => {
    d3.select(anchor).call(d3legend.legendColor().scale(colorScale))
  })

  return <g transform={`translate(${x}, ${y})`} ref={ref} />
}
Lets us render any D3 code into an anchor element and wrap it in a React component. Behind the scenes useD3 is a combination of useRef and useEffect.
Enjoy ✌️